Plane Stress
example problem
Given: The wrench shown is made
of a steel with a yield strength of 45,000 psi. and is loaded with a pressure
of 150 psi. along its handle as shown. It is 0.4 inches thick and about 7
inches in length.
Find: Determine if any yielding
occurs because of this load.
Solution: The geometry was created in
Pro/E, saved as an IGES file and imported into ANSYS 6.1. The plane2 6 node
triangle element, plane stress with thickness option was used in the modeling.
Material
properties were E = 3.e7 psi, nu = 0.3.
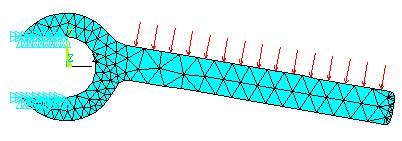
Boundary conditions ux = uy = 0 were applied along the lines where the wrench contacts the bolt.
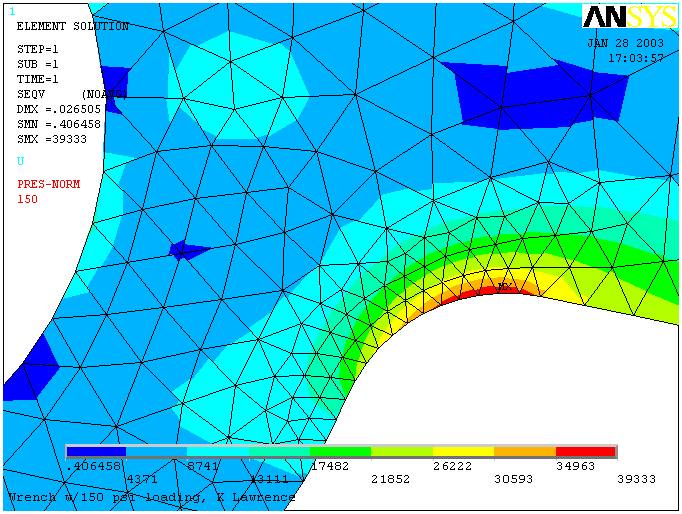
The
mesh was refined to eliminate element-solution stress contour discontinuities.
The following plots of von Mises stress show a maximum value of 39,333 psi at
the fillet radius on the underside of the wrench.
Data
entered Interactively:
Element
Type:
LIST ELEMENT TYPES FROM 1 TO 1 BY 1
ELEMENT TYPE 1 IS
PLANE2 2-D 6-NODE TRI. STRUC.
SOLID INOPR
KEYOPT(1-12)= 0 0
3 0 0 0 0
0 0 0 0 0
0
CURRENT NODAL DOF SET IS
UX UY
TWO-DIMENSIONAL MODEL
Thickness:
LIST REAL SETS 1 TO 1 BY 1
REAL CONSTANT SET
1 ITEMS 1 TO
6
0.4000
0.0000 0.0000 0.0000 0.0000 0.0000
Material
Properties:
EVALUATE MATERIAL PROPERTIES FOR
MATERIALS 1 TO 1 IN INCREMENTS OF 1
MATERIAL NUMBER = 1
EVALUATED AT TEMPERATURE OF
0.0000
EX = 0.30000E+08
PRXY =
0.30000
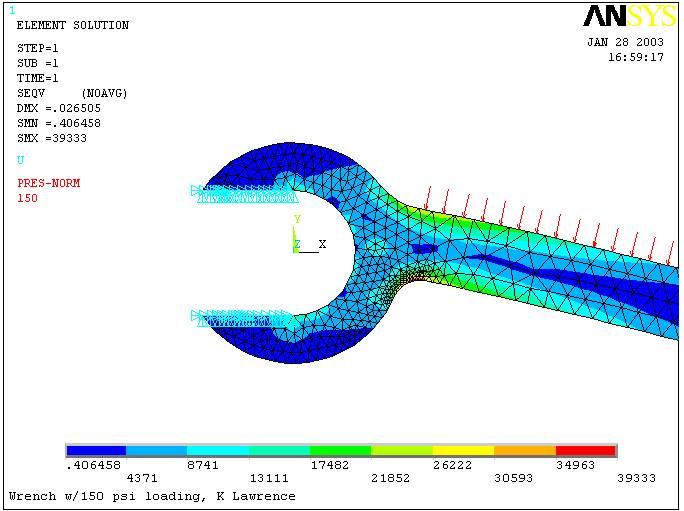
(Note: To properly document
the model, the axis system, loads and boundary conditions are shown on this
plot.)
Results:
The
maximum von Mises stress, SEQV = 39,333 psi, is less than the material yield
strength of 45,000 psi, so no yielding is likely to occur.
(Note:
In some cases it may be necessary to identify stresses or strains at critical
elements and/or nodes, turn on element or node numbering and list the computed
values at those locations as shown in ANSYS Tutorial Fig. 3-10. In the above we
just used the contour plot legend.)